Business
Business Insight: How to Do Sales Forecasting
At a recent departmental Cycle Meeting, I heard a colleague from L&D share some internal learning resources. I gave them a quick try, and it was also a good chance to study some proper business knowledge and get back to serious work. The course content was quite good, so I am also sharing how to do sales forecasting here, hoping it may help readers who need it.
On this page
Foreword
At a recent departmental Cycle Meeting, I heard a colleague from L&D share some internal learning resources. I gave them a quick try, and it was also a good chance to study some proper business knowledge and get back to serious work. The course content was quite good, so I am also sharing how to do sales forecasting here, hoping it may help readers who need it.
Understanding Sales Forecasting
1. What Is Sales Forecasting?
Sales forecasting is a prediction of a sales department’s performance over a period of time. It can help managers and marketers coordinate around key business priorities, especially limited funds or resources. The essential point is to minimize the gap between the forecast value and the actual sales value as much as possible.
At the same time, there is also the concept of safety stock, which aims to reduce as much as possible the consequences of forecasts that are too low or too high. Ultimately, it helps companies operate better while protecting them from uncertainty.
2. The Importance of Sales Forecasting
Sales forecasting affects quite a wide range of areas in actual business operations. Its importance includes, but is not limited to:
- Affecting corporate financial planning: influencing stock prices or managers’ investment decisions;
- Building and managing sales teams: influencing territory design, sales target setting, performance evaluation, and so on;
- Affecting operating decisions in collaborating departments: support departments may be influenced by sales forecasts when allocating resources, such as dividing speaker quotas;
- Affecting people-management approaches: influencing how HR designs employee compensation and benefits structures, and when to conduct recruitment activities at what scale, and so on;
- Affecting the scale of corporate investment: providing expectations for the cash flow of an acquisition target, thereby determining the acquisition amount.
3. The Sales Forecasting Process
Sales forecasting is a systematic process involving multiple business functions. To conduct sales forecasting, you need to build the right team (Win as ONE Team; teamwork allows all departments to align around the forecast), identify team members and roles (sales team, marketing team, finance department, operations department), and clarify project goals and timelines.
The brief process is as follows:
- Analyze the market: business category, market size, market trends and dynamics, and so on;
- Collect data: collect only data relevant to the forecast; if desired data is missing, reasonable assumptions can be made;
- Determine the method: qualitative, quantitative, or a combination of both;
- Test the forecast: run the forecasting model against historical sales cycles, test its effect, and determine whether further adjustments are needed;
Preparing for Sales Forecasting
1. Define the Market Category
The market category is your competitive space. The competitive space can be defined very broadly (more competition), or very narrowly (less competition), depending on the product and business model. When doing sales forecasting, it is best to invite colleagues from the marketing department to participate and understand how they define the market category.
In addition, you need to understand the existing market trends in each category: are sales rising, falling, or flat? At the same time, you also need to understand the factors behind those trends so that you can make more accurate forecasts.
2. Understand Market Dynamics
We are more familiar with internal company information, but external market dynamics often directly affect the accuracy of sales forecasting results. For example, competitors’ market strategies and marketing activities may affect our sales volume.
In addition, we should actively understand the impact of laws, regulations, and political changes on sales expectations. Beyond that, there are customer behavior, technological changes/innovations/breakthroughs, internal business strategy changes, and so on.
3. Choose a Forecasting Method
Forecasting methods fall into two categories: qualitative and quantitative. Qualitative methods rely more on people’s inputs, while quantitative methods rely more on numerical data inputs. Excellent sales forecasters combine and apply both methods comprehensively.
Before choosing a method, you can test yourself with the following questions:
- How well do I understand the market?
- Is the market growing or declining? Why?
- Are there new consumer (customer), competitor, or technology trends?
- Is my market a seasonal business?
- How well do salespeople and distributors understand the market?
- How much past sales data do I have?
- What methods did my predecessor use? Were they successful? Were there any major forecasting errors?
A beginner can use qualitative methods first to obtain relevant professional knowledge and market information.
A good forecast should combine quantitative and qualitative methods.
Using Quantitative Forecasting Methods
1. Collect Data
The most commonly used data source is historical sales data. However, it is important to use clean data, meaning the data must meet requirements such as being accurate, undistorted, and undamaged. We should find as much historical sales data as possible, and we can ask colleagues from finance or IT to help collect the most accurate and comprehensive existing data.
Before using it, we also need to check the data. First, be sure to determine the time period corresponding to the sales data, such as hourly, daily, monthly, quarterly, or yearly. Use quarterly data as much as possible; research shows that this time cycle often produces more accurate forecasting results. Then, plot how the data changes over time. A trend chart can vividly show historical changes in sales data and can also reveal obvious abnormal fluctuations; at that point, you need to understand the reasons behind the fluctuations. Finally, pay attention to other details, such as whether discount factors exist.
The key is to keep the data consistent, and to remove historical data that does not reflect the current business.
2. Rolling Method
The principle of rolling forecasting is: past actual sales = future sales forecast. It is more suitable for businesses with stable sales revenue and sales volume that is not affected by seasonal factors. For example, we can use last month’s actual sales result as next month’s sales forecast.
The advantage of rolling forecasting is that it can serve as a benchmark for comparison with other forecasting methods. By comparing the size of the average error, you can determine whether to use the rolling forecasting method.
Tip: When calculating absolute error, you can use the ABS function in Excel. ABS stands for absolute, and its usage is as follows:
= ABS(C3-B3)The result returns the absolute value of C3-B3; even if it is negative, it will return the positive form.
3. Moving Average
The moving average method uses the average sales from the past few months as the sales forecast for the next month. For example, the average sales from months 2 - 5 = forecast sales volume for month 6 in this example.
If sales volume is affected by seasonal factors, we can also apply weights to the moving average, which is the weighted moving average method. For example, month 2 sales volume * 10% + month 3 sales volume * 20% + month 4 sales volume * 30% + month 5 sales volume * 40% = month 6 forecast sales volume. The weighting coefficients need to be determined according to the actual situation.
4. Exponential Smoothing
The smoothing forecasting method is simple to calculate. It requires only the current-period sales volume (A), the current-period forecast value (F), and the current-period weighting factor (S, the smoothing coefficient). That is:
(A*S)+(F*(1-S))
# A = 最近时段的实际销量
# S = 平滑系数,采用小数形式
# F = 最近时段的预测值(上一个时段的平滑计算结果)
The smoothing forecasting method considers both historical actual sales volume and historical forecast values.
- Question: How should the smoothing coefficient be determined?
Using Qualitative Forecasting Methods
1. Use Estimates Provided by Customers
Accuracy is based on how well we understand our customers, and how well customers understand themselves.
Customers can be divided into 4 categories:
- Customers who buy products only from you
- Customers who also buy products from you
- Customers who buy only competitors’ products
- Customers who do not buy this type of product at all
Use a top-down method: first, estimate the total number of customers; second, determine the proportion of each customer type; then estimate the potential sales for each group based on customer numbers and aggregate them.
Use a customer-centered forecasting method: research what customers plan to buy from us in the future and what their spending plans are, then make an estimate.
2. Use Estimates Provided by Sales Representatives and Distributors
First, ask sales representatives and distributors to estimate total annual sales volume, then break it down by month or quarter.
It is important to note that the greatest risk in asking sales representatives and distributors to estimate sales volume is that they are unlikely to distinguish between sales forecasts and sales targets (sales quotas). Sales representatives tend to set sales targets lower than the actual market situation.
You should avoid sales representatives “sandbagging.” Sandbagging means artificially lowering the sales forecast in order to obtain a sales target (sales quota) that is easier to achieve. This is also why qualitative and quantitative methods need to be combined.
In addition, for estimates provided by sales representatives, you need to further understand what assumptions their conclusions are based on. For example: adding new customer development? Losing customers? New competitors appearing in the territory? Price changes? New marketing campaigns? Newly launched products?
Finally, you can use expected value (EV) analysis. Expected value is a forecast for a given region, calculated by multiplying each possible outcome by its respective probability and then summing all outcomes. That is:
EV=可能值*各自概率You can ask sales representatives or distributors how much sales revenue each customer can generate, and what the probability is:

Calculation result:
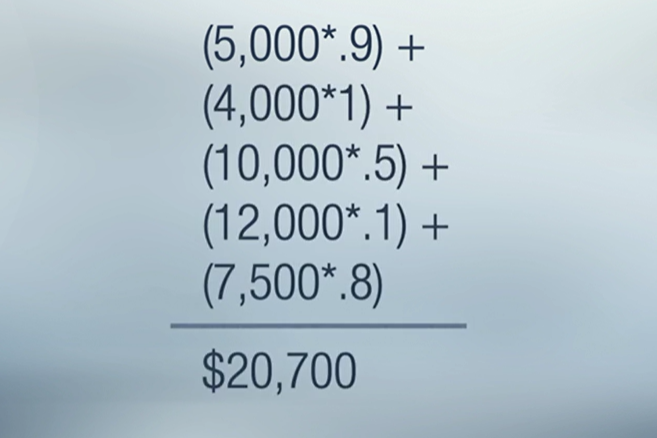
Compared with asking sales representatives to provide total annual sales volume forecasts, expected value analysis has a smaller error. At the same time, expected value analysis also uses sales representatives’ tacit knowledge of their own territories, and that knowledge can help us make more accurate sales forecasts.
3. Listen to an Expert Panel
When you are in an unpredictable market, experts’ insights often help reduce forecasting errors. When building an expert panel, you should look as much as possible for people with diverse and distinctive views of the industry. These people may be distributed across different links in our business pathway and can be invited according to actual needs. The diversity of the panel also helps eliminate biases that any one panel member may have.
After establishing the expert panel, you need to determine what information you should obtain from them. For example, should you estimate new cases nationwide, regionally, or within a target market, or should you estimate the number of new cases each year, each quarter, or even each month? You should clearly define the questions the expert panel is best suited to solve, so that you can obtain unique information.
It should be noted that the most important thing is not each person’s forecast result, but the assumptions used by the panel members. These assumptions can provide the most critical information for setting a reasonable forecast. Accept important assumptions and find ways to validate them.
Summary
When I first saw the Sales Forecasting course, I did not take it nearly as seriously as I did after finishing it. As a colleague in a company support function, Professor’s main job responsibilities are more related to technology, and are instead somewhat distant from sales management in the real world. Studying the Sales Forecasting course this time broke my previous inertial thinking to some extent, and can also be considered an opportunity to fully embrace business management.
In fact, if we use the Sales Forecasting course to look at the changes and turbulence in the industry over the past few years, it is easy to find that many emerging innovative companies may not have done a good job with commercialization, especially with reasonable sales management. Perhaps when the market and investment environment are good, everything is fine. But once they encounter changes in the external policy environment or a capital winter, they have no choice but to cut the size of their sales organizations on a large scale, which in fact accelerates the deterioration of the industry environment.
At present, we are in a period of historic transformation. Many market changes are things we have never encountered in experience, and the challenges of industry transformation are placing higher demands on every company. How to improve the efficiency and effectiveness of commercial teams in a rapidly changing market environment by integrating limited resources, thereby maximizing business value, is worth deep reflection by everyone in the industry.
In this winter with such unusually strange weather, learning a little more knowledge is never a bad thing.